

|
Roadmap To Profitability Financial Dashboard
Using Our Proprietary Technologies to Give You a Competitive Advantage
|
Taylor Business Group is pleased to offer the Roadmap to Profitability Financial Dashboard, a revolutionary way of looking at your financials.
You no longer need to be baffled at what your income statement or balance sheet is telling you. The Roadmap to Profitability Financial Dashboard will display in graphical terms how each segment of your company is performing by comparing your results to the Taylor Business Group's industry leading performance benchmarks.
This is an online service. You simply upload your chart of accounts, income statement and balance sheet in a CSV format to a secure location on our website and these reports are automatically generated for you. You choose the time period(s) for the reports.
Roadmap to Profitability Income Statement Dashboard
Through the use of gauges, you will be able to determine if you are not meeting the benchmarks (in the red), close but not at the benchmarks (in the yellow) or exceeding the benchmarks (in the green) as shown below:
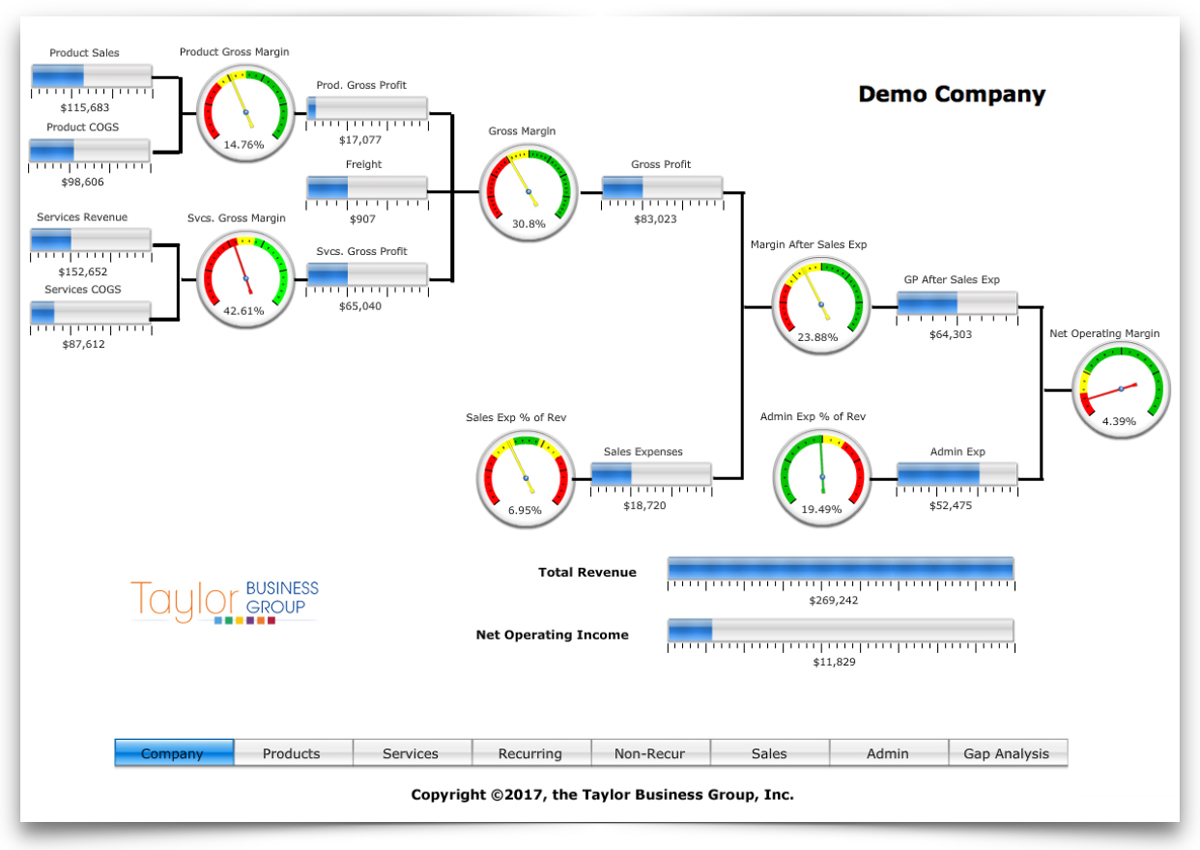
This first page, as seen above, is an overall snapshot of your income statement for the period you have selected. You can drill down into the details of each segment of your business by clicking any of the other tabs (Products, Services, Recurring, Non-recurring, Sales or Admin).
When you click one of those tabs a detail of that part of your business appears:
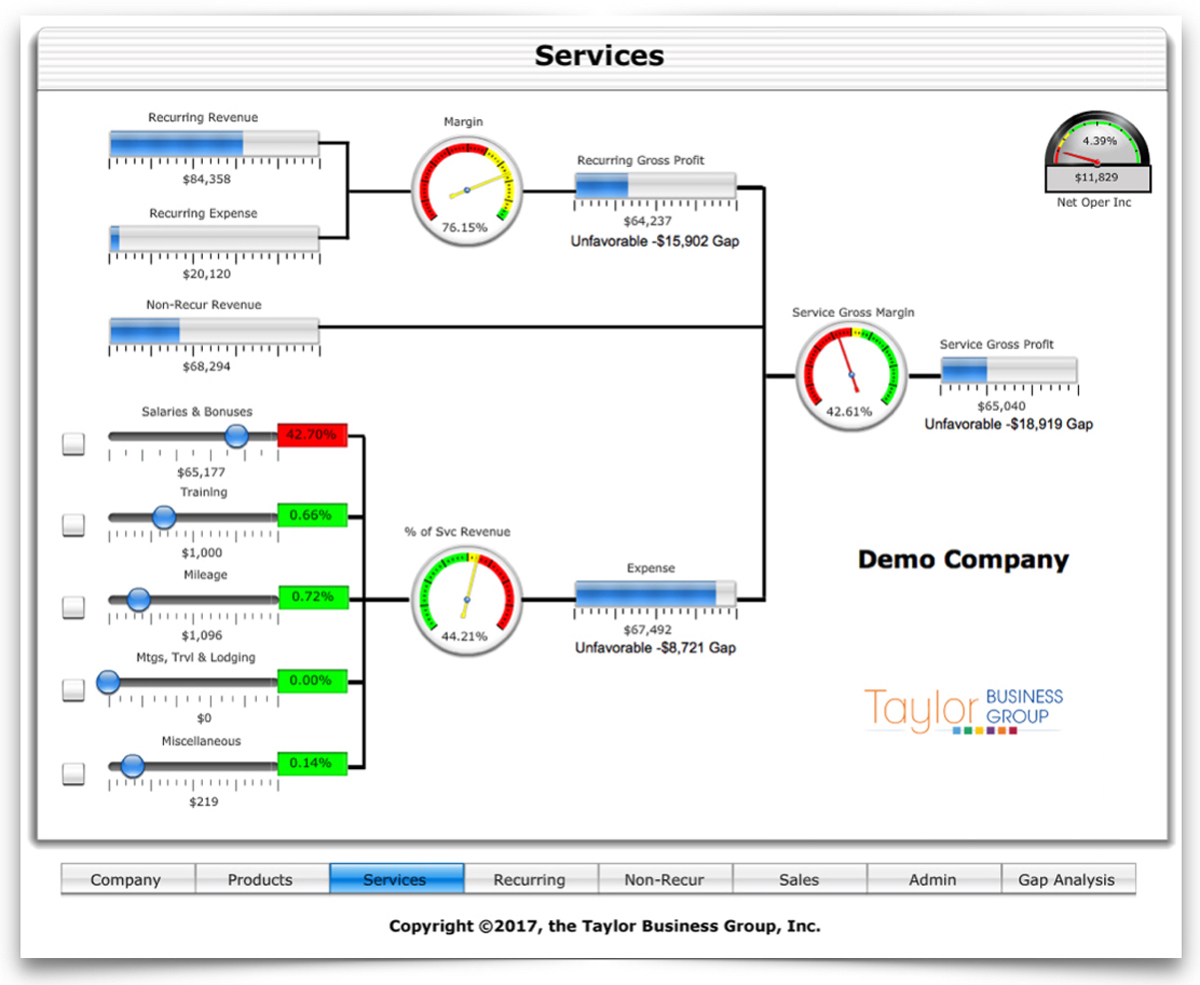
On any of those tabs (Services was chosen as seen above), you can view your financial performance in detail for that part of your business. Note that on some of the displays there is a blue ball. This is a slider that will allow you to adjust the values of an item.
For example, on the page above you see that Service Salaries is in the red. You can move the blue ball slider to the left to see the overall effect of reducing the salaries (until it turns green) for your service department's profitability and the effect on the overall company's profitability (see the gauge in the far upper right hand corner). This feature allows you to play the ‘what if" game with any of your numbers.
Roadmap to Profitability Balance Sheet Dashboard
Many of us pay too little attention to our Balance Sheet. Our creditors, however, pay a lot of attention to our Balance Sheet.
The Roadmap to Profitability Financial Dashboard produces gauges that show the results of:
- Current Ratio
- Quick Ratio
- Debt Ratio
- Sales Days Outstanding
- Return on Assets Ratio
An example of the Current Ratio is seen below:
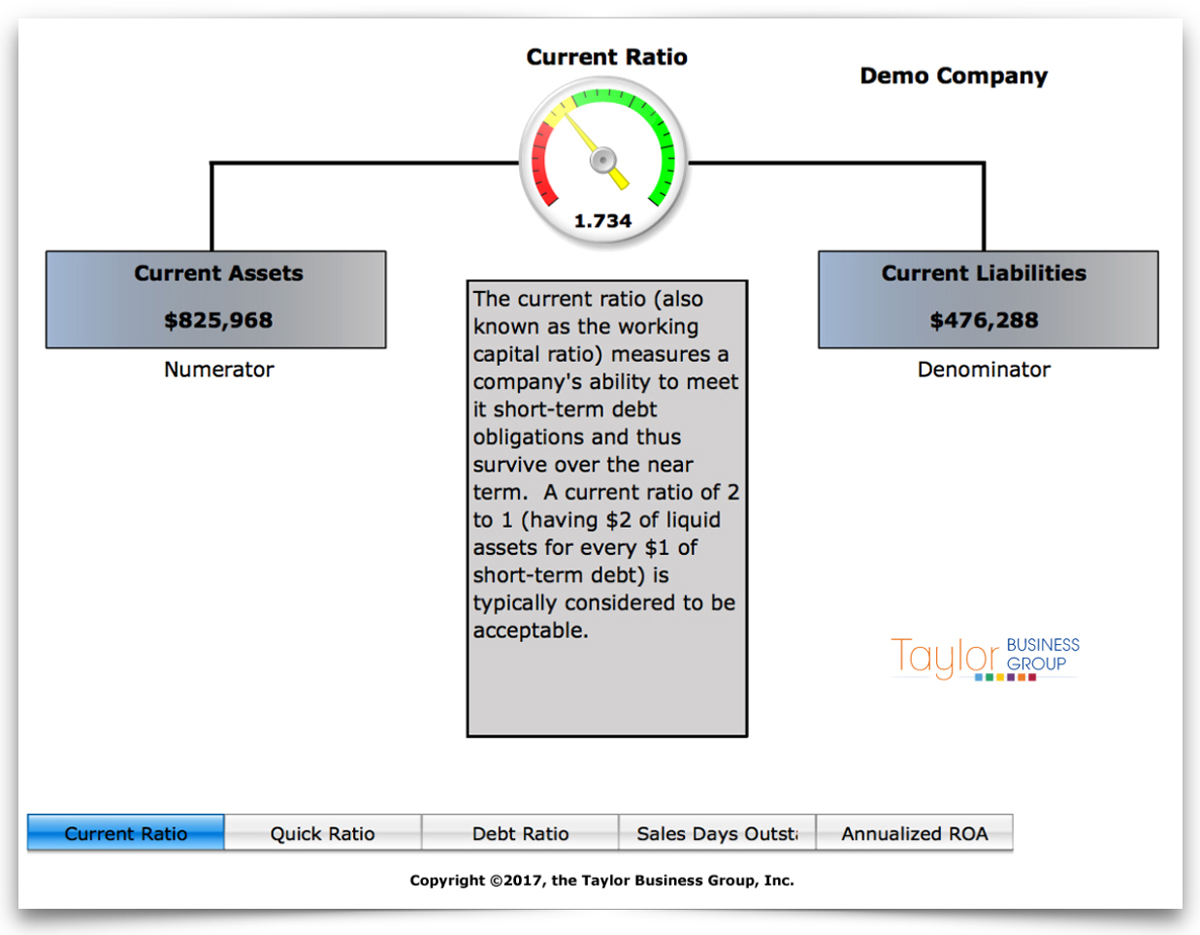
Note that there is an explanation of how the ratio is calculated and why it is important to you. Now you have the opportunity to view the financial well being of your business in a way that makes sense and in a manner that will allow you to take action on any ratio that is not meeting expectations.
Roadmap to Profitability Trending Dashboard
The final aspect of the Roadmap to Profitability Financial Dashboard is trending. In essence, how are the components of your business performing over time. Up to 24 months of data can be accumulated for the trends.
An example of a trend page is found below:
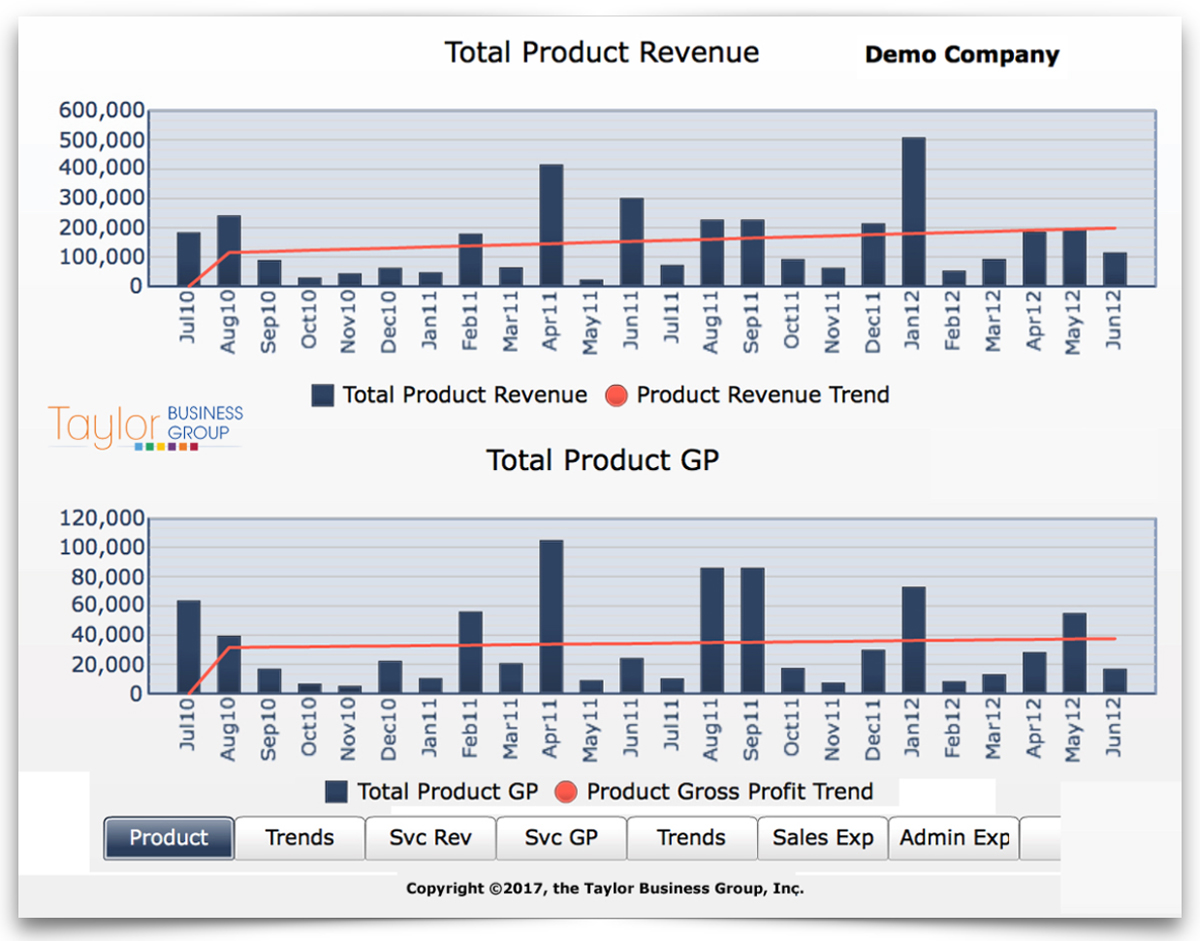
There are 6 basic areas of trending:
- Product
- Service Revenues
- Service Gross Profit
- Sales Expense
- Administration
- Net Operating Income
Now you can look over multiple time periods at how you are improving your business, and, at the pace you are going, project what your business is will produce in all of the categories just listed.
For a complete demonstration of this service, please click here.
If you would like to speak with someone directly about Taylor Business Group’s Roadmap to Profitability Financial Dashboard, please contact Jeff Razafsky at (331) 251-1279, or email Jeff at This email address is being protected from spambots. You need JavaScript enabled to view it..
Taylor Business Group has been a leader in the IT industry for almost two decades. As evidenced by clients who represent nearly $400,000,000 in annual revenue, Taylor Business Group has developed the metrics and methods that drive business success. The average Net Operating Income (NOI) for our members has increased by four percentage points in their first two years. This translates to an extra $40,000 of income for every $1,000,000 of top-line revenue for our members. That's over $16,000,000 of additional real profit created annually!